In this video, we’ll guide you through the “See Data Report” page, where you can effortlessly view and manage client-provided data. This tutorial will walk you through each step, ensuring you can tailor this space to your needs and preferences.
Step 1: Configure your Data Visualization
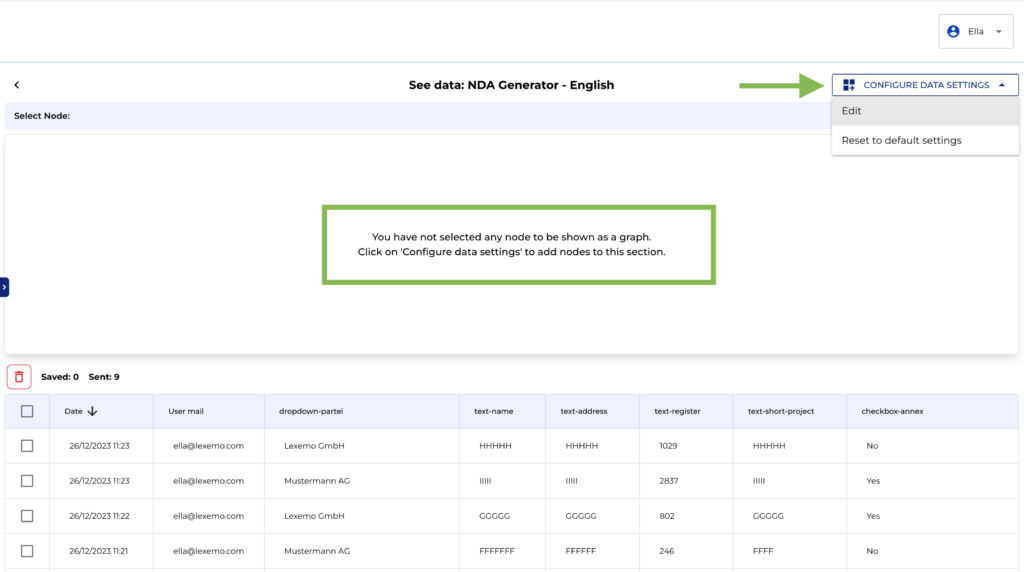
Initially, the ‘See Data’ page might display a message indicating the absence of nodes. This is normal for first-time bot use.
Activating the Graphs Feature:
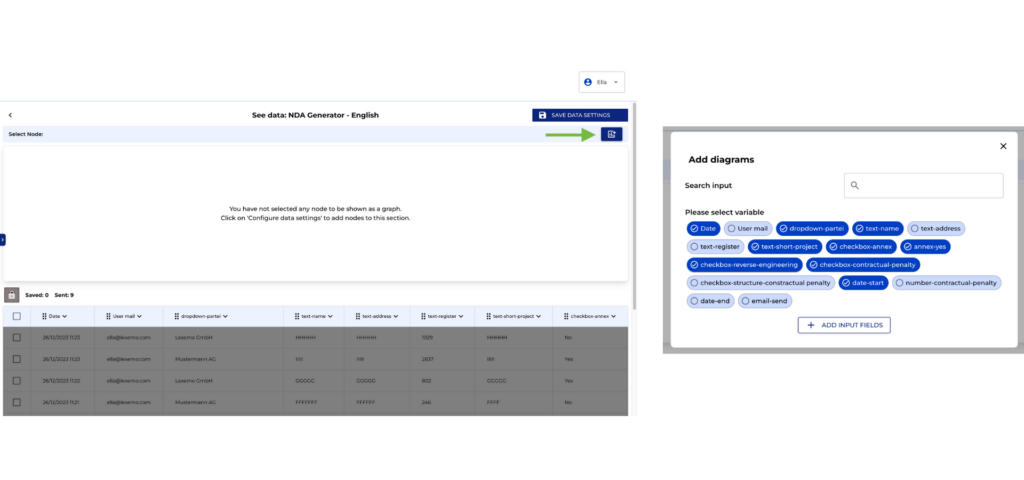
Click on “Configure Data Settings” followed by “Edit.” This action enables the graphs icon. Click on it and a modal will open. Here you will see the different nodes that your legal bot contains. Select the ones that are relevant to you or delete them later from the “X” icon of the node chip if you no longer need them. Also, you can click over the chip to deactivate it; this way you won’t see the graph of this node until you activate it back. And one more option, is to relocate the nodes by clicking over the dots and dragging the chip to a new location.
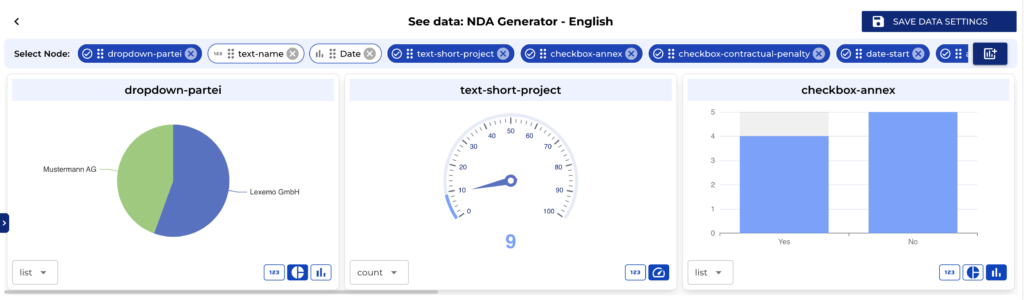
Customizing Graph Styles:
Each graph offers several visualization styles. Simply click on the style buttons within each graph box to switch between them.
Resetting to Default:
To revert all changes and return to the original settings, select “Reset to Default Settings.” from the “Configure Data Settings” button.
Step 2: Configure your Table of Data
Accessing Client Data:
Located at the bottom of the page there is a table containing all client data, which can be downloaded as an .svc file.
You can modify the table to show most relevant data for you and your clients. Click on “Configure Data Settings” to start customizing.
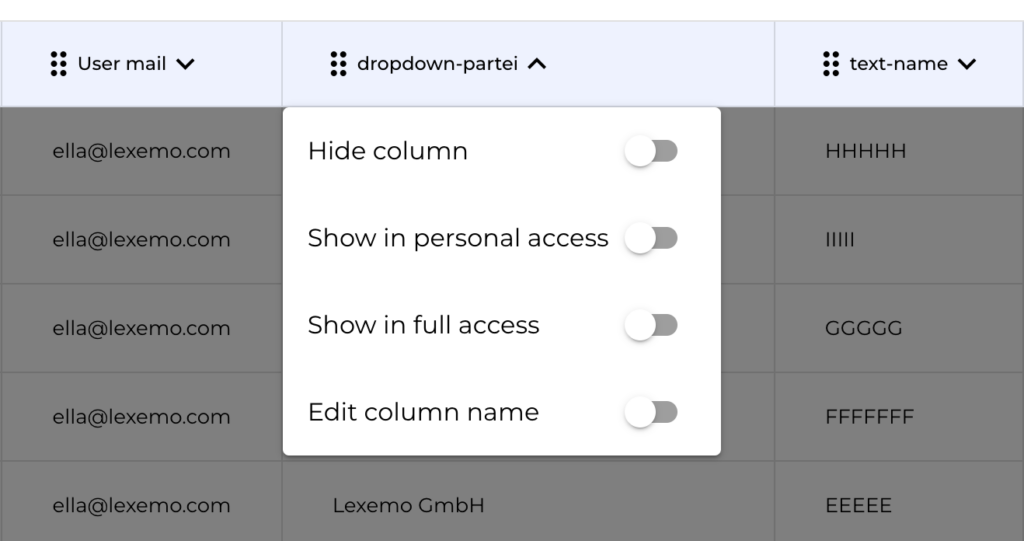
Column Customization Options:
- Hide Columns: Choose to make certain columns invisible in the Client Data report.
- Show in Personal Access: This option allows only clients with personal access to view the data report.
- Show in Full Access: Data is visible to all clients, regardless of their access level.
- Edit Column Name: While columns default to the names assigned to nodes, you have the freedom to rename them for clarity.
Relocate node graphs:
Click over the dots and drag the column to your desired position within the table.
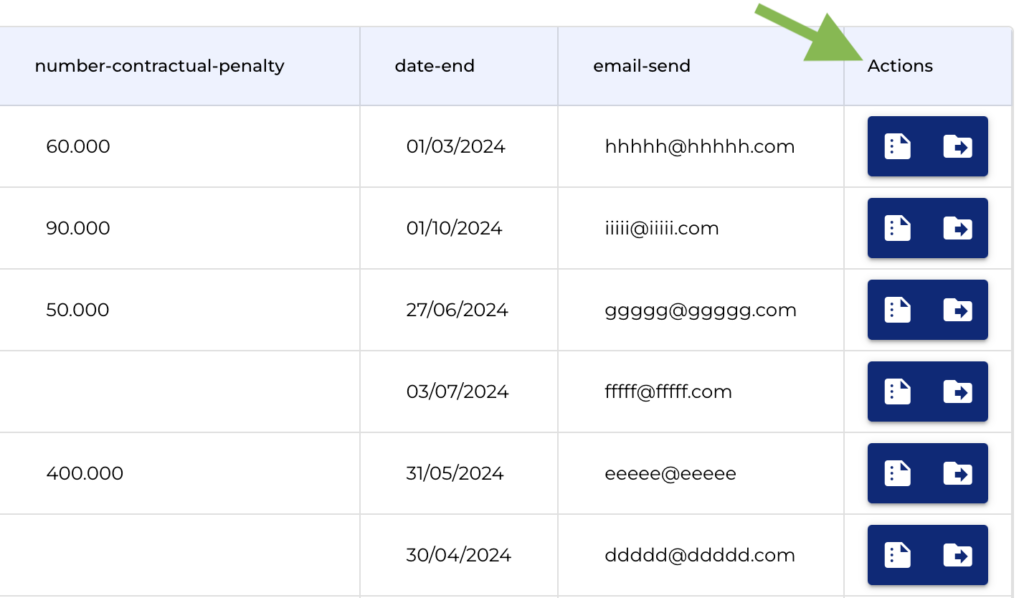
Downloading documents:
Also, under the column “Actions”, you can download each of your client generated documents or visualize your client’s answer in the frontend.
In this video, we’ve outlined the process of customizing the “See Data Report” page, from configuring data visualization to tailoring the data table. These steps will empower you to make informed decisions and present data in a more engaging and understandable way. Happy customizing!